Welcome Page
Dashboard Layout
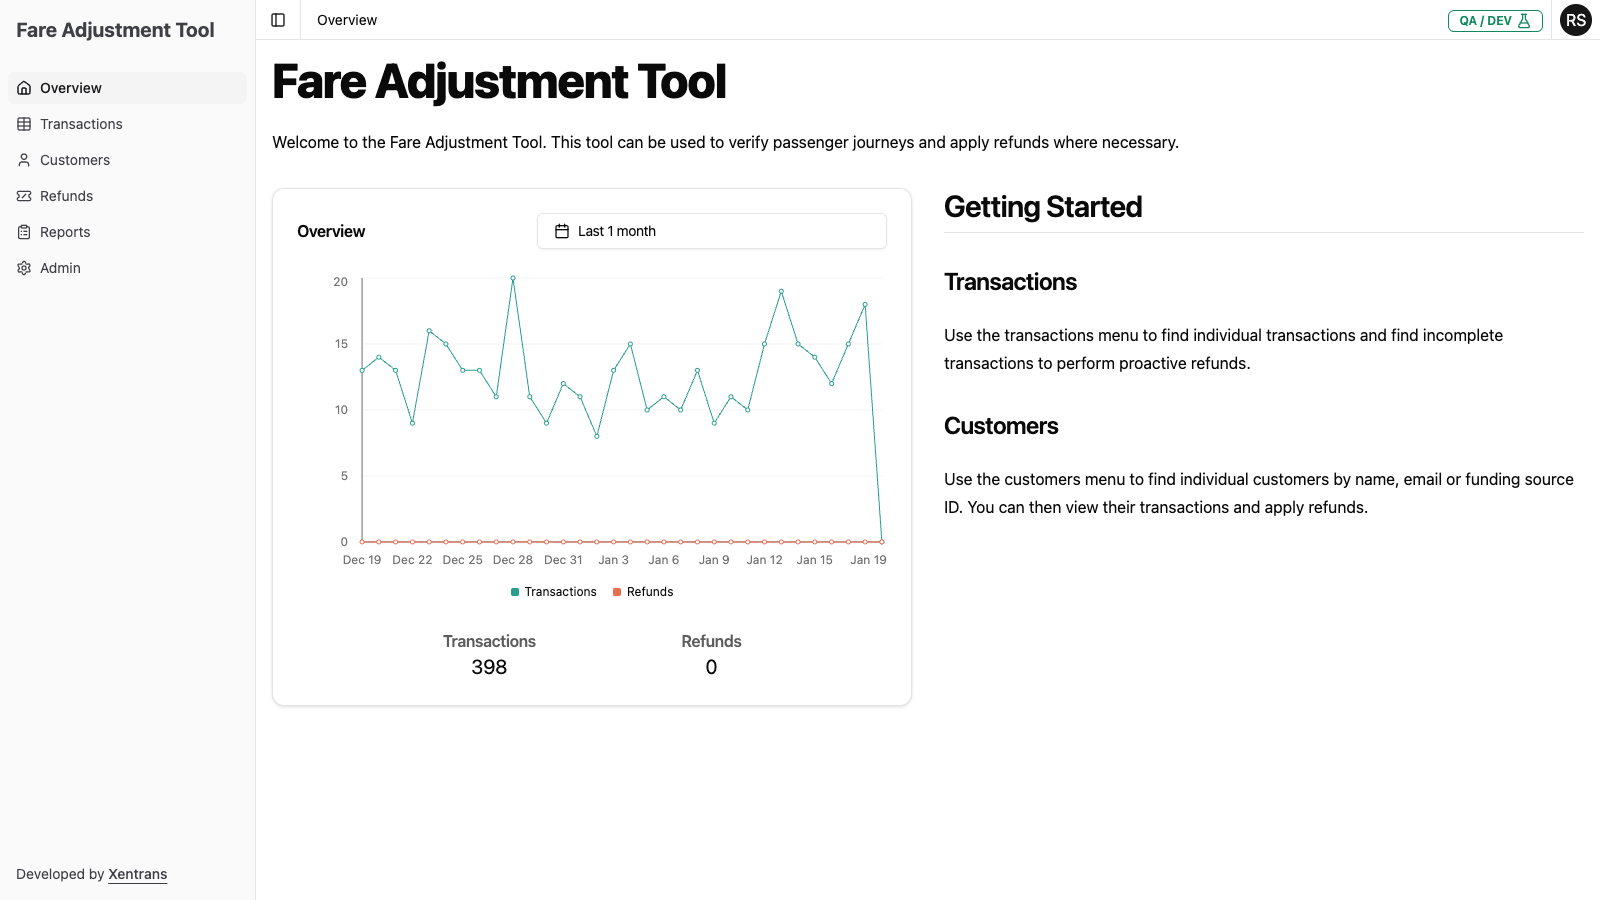
The Overview page is divided into two main sections:
1. Activity Chart
The center of the dashboard displays an interactive chart showing:
- Transactions (shown in teal/green) - The number of transit transactions per day
- Refunds (shown in orange) - The number of refunds processed per day
Changing the Time Period
Above the chart, you'll find a date range selector. Click on it to change the time period displayed:
- By default, the chart shows the Last 1 month of activity
- You can select different time ranges to analyze trends over various periods
Reading the Chart
- The X-axis shows dates
- The Y-axis shows the count of transactions or refunds
- Hover over data points to see exact values for a specific day
3. Summary Statistics
Below the chart, you'll see summary totals for the selected time period:
| Metric | Description |
|---|---|
| Transactions | Total number of transactions in the selected period |
| Refunds | Total number of refunds processed in the selected period |
2. Quick Navigation
From the Overview dashboard, you can quickly navigate to:
- Transactions - Click on the Transactions menu item to dive into transaction details
- Customers - Click on the Customers menu item to search for specific customers
- Refunds - Click on the Refunds menu item to view refund history
- Reports - Click on the Reports menu item to generate refund reports